


DBT Bureau
Pune, 11 Feb 2026
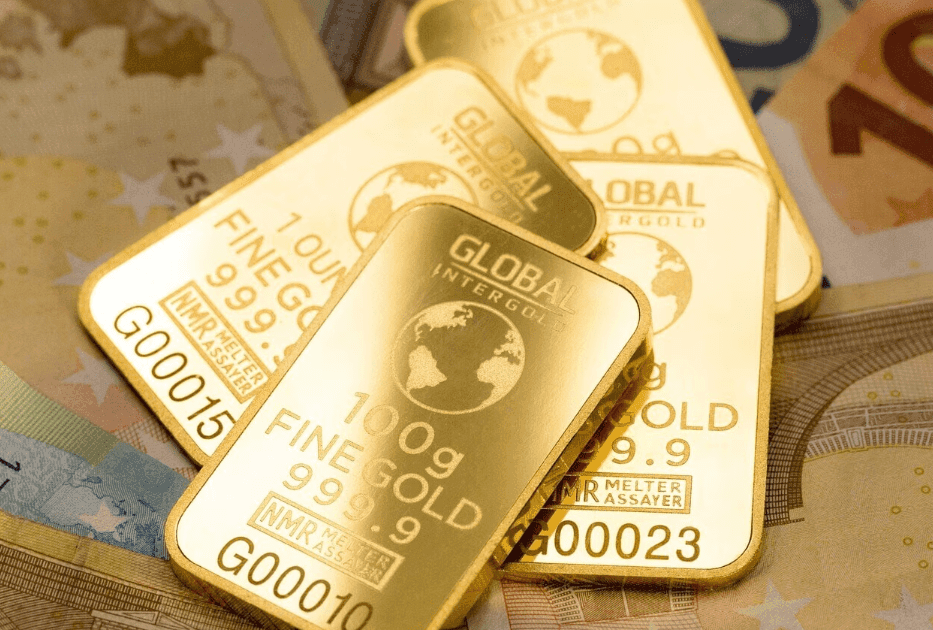
Gold prices steadied above USD 5000 a troy ounce in early February, after an episode of extreme volatility that erased nearly half of January’s gains amid easing geopolitical tensions and a shift in the U.S. Federal Reserve’s monetary policy outlook.
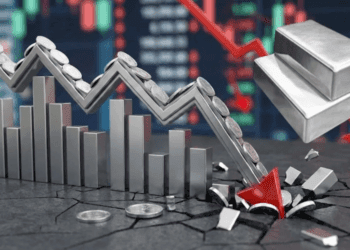
- Gold surrendered half of its January gains during the month-end liquidation, after having earlier reached a record high of USD 5594 per troy ounce in the London spot platform.
- Gold prices in both LBMA and COMEX hovered above USD 5000 per troy ounce with a gain of over 10% over the last monthly period.
- In India’s MCX platform, gold prices surged 8% over the last monthly period.
- Total gold demand in 2025, including OTC activity, surpassed 5000 tonnes for the first time. – World Gold Council.
- China’s central bank, PBOC, extended its gold purchases for a 15th consecutive month in January. The country’s gold reserves rose to 74.19 million fine troy ounces at the end of January, compared with 74.15 million a month earlier.
- Global equity benchmarks were mostly traded in positive territory last week, except China’s SSE index.
- The U.S. Federal Reserve kept interest rates unchanged at the 3.50%–3.75% range following its January policy meeting.
- The U.S. Dollar Index, a gauge that measures the greenback against six major rivals, traded near the 97 mark last week.
- The Indian Rupee slumped to an all-time low of 92 against the U.S. dollar in late January, a move that subsequently accelerated gold prices in the domestic market.
- The currency peers, Euro and Japanese Yen slipped while Chinese Yuan gained against USD last week.
- The gold-backed ETF inflows with SPDR remained robust for eight consecutive months in January.
GOLD REPORT:
Gold spot hovered above $5000/oz Gold prices experienced a sharp surge in January, with LBMA spot prices starting near USD 4330 per troy ounce and climbing to USD 5594 before pulling back. A significant portion of these gains was erased by heavy month-end liquidation. Easing geopolitical tensions contributed to the retreat from record highs, as did speculation that the Federal Reserve may appoint Kevin Warsh as its next chair, an appointment viewed as signalling a potentially more hawkish monetary policy. Despite the bout of extreme volatility, gold prices steadied above USD 5000 per troy ounce.
Total gold demand in 2025, including OTC activity, surpassed 5000 tonnes for the first time. Coupled with a record-setting gold price, which hit 53 new all-time highs during the year, this drove the total market value to an unprecedented USD 555 billion, a 45% year on year increase. Investment activity was the primary driver of this growth. Global gold ETF holdings expanded by 801 tonnes, marking the second strongest annual increase ever, while bar and coin demand surged to its highest level in 12 years. Central banks added 19 tonnes of gold in December 2025 based on IMF and other public sources, bringing full-year reported net purchases to 328 tonnes, slightly below the 345 tonnes recorded in 2024.
Momentum continued into the new year, with global investors increasing allocations to physically backed gold ETFs. In January, gold ETFs saw inflows of USD 19 billion, the strongest monthly intake on record. Combined with a 14% rise in gold prices, these inflows pushed global ETF AUM to a record USD 669 billion, up 20% for the month. Total global holdings grew by 120 tonnes to reach a new all‑time high of 4145 tonnes.
Fed kept the rates steady in the January meeting
The U.S. Federal Reserve kept interest rates unchanged at the 3.50%–3.75% range following its January policy meeting. Chair Jerome Powell highlighted that economic conditions remain robust and that risks surrounding both inflation and employment have moderated. This assessment indicates that the central bank may delay any additional rate cuts for an extended period.
China’s Gold consumption declined for a second year in 2025. China’s gold consumption declined for a second straight year in 2025, falling 3.57% to 950.096 tonnes. Jewellery demand dropped sharply by 31.61% to 363.836 tonnes, reducing its share to 38% of total consumption. In contrast, bar and coin purchases rose 35.14% to 504.238 tonnes, surpassing jewellery demand for the first time as safe‑haven interest increased. Overall, the drop in jewellery buying exceeded the rise in bar and coin demand by 37 tonnes.
SPDR gold backed ETFs Physical holdings eased in February SPDR gold-backed ETF holdings have slipped modestly in February, declining by 0.68% so far after eight consecutive months of inflows through January 2026. This follows increases of 1.54% in January and 2.40% in December. As of the week ending February 6, the SPDR Gold Trust held 347.12 million ounces of physical gold.
Gold-US dollar correlation
The correlation between gold and the U.S. dollar has turned negative again, suggesting that a decline in the dollar could provide upward momentum for gold.
Outlook
Gold prices are expected to remain supported by sustained central bank purchasing and strong ETF inflows, even as geopolitical tensions ease and trade-related uncertainties diminish. Speculation that Kevin Warsh could succeed Jerome Powell as the next Federal Reserve Chair introduced additional volatility, as investors reassessed the potential implications of a shift in U.S. monetary policy. Nevertheless, once this period of turbulence and liquidation subsides, the market is likely to refocus on the underlying structural drivers that continue to underpin bullion demand.
Technical View
London Spot: The MACD bullish divergence signals positive market sentiment, but the Relative Strength Index (RSI) remains in overbought territory, suggesting the possibility of continued profit booking and liquidation. However, prices are likely to remain range-bound after intermittent bursts of volatility. A decisive break above the $5,155/oz level could open the door for further upside, with the possibility for subdued buying pressure. Meanwhile, a drop below the $4,650 support zone may signal additional downside risks.
MCX: Sustaining the upward momentum would require strong, volume-generated trades above the Rs 165,000 level. Conversely, a drop below the Rs. 150,000 region may increase the likelihood of additional downside pressure.
Disclaimer: Any views, opinions, or investment-related information expressed by contributors on Databiztimes.com are solely their own and should not be construed as investment advice. Readers are advised to consult SEBI-registered or certified financial advisors before making any investment decisions.


