DBT Bureau
Pune, 18 Sep 2024
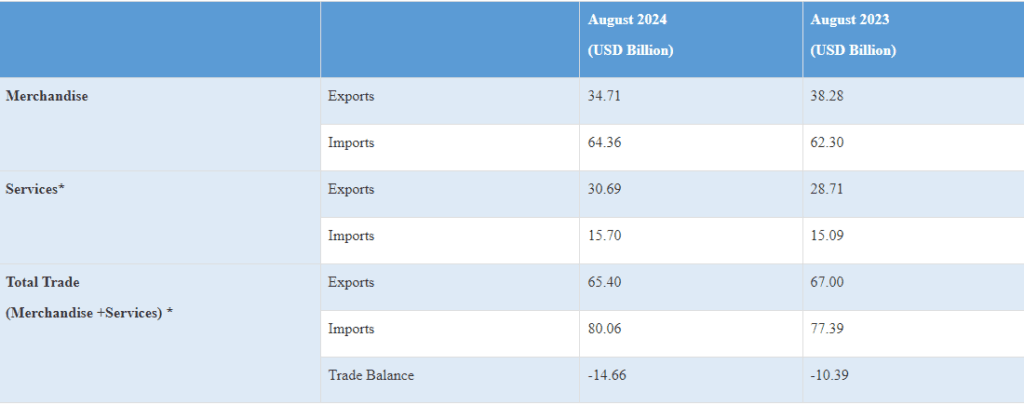
India’s export sector is on the rise, with cumulative overall exports for April to August 2024 estimated at USD 374.33 billion, reflecting a growth of 5.35% compared to USD 350.11 billion during the same period in 2023. The merchandise exports alone saw a modest increase, reaching USD 178.68 billion, up from USD 176.67 billion last year, marking a growth of 1.14%.
In August 2024, non-petroleum and non-gems & jewellery exports demonstrated notable resilience, rising by 2.35% from USD 26.14 billion in August 2023 to USD 26.76 billion this year. This increase signals a strengthening in the diversification of India’s export portfolio.
Key sectors driving this growth include Engineering Goods, Organic and Inorganic Chemicals, Electronic Goods, Ready-made Garments (RMG) of all textiles, and Drugs & Pharmaceuticals.
Engineering Goods saw an increase of 4.36%, rising from USD 9.05 billion in August 2023 to USD 9.44 billion in August 2024.
Organic and Inorganic Chemicals exports surged by 8.32%, climbing from USD 2.19 billion to USD 2.37 billion.
Electronic Goods exports rose by 7.85%, from USD 2.16 billion to USD 2.33 billion.
The RMG of all Textiles category experienced the most significant boost, with exports increasing by 11.88%, from USD 1.13 billion to USD 1.27 billion.
Drugs & Pharmaceuticals exports grew by 4.67%, from USD 2.24 billion to USD 2.35 billion.
These figures highlight the resilience of India’s export sector amid global economic uncertainties, underscoring the country’s ability to leverage its strengths in various industries. As India continues to enhance its trade relationships and expand its export base, stakeholders remain optimistic about sustained growth in the coming months.
- Exports of Coffee (69.55%), Tobacco (34.45%), Spices (19.13%), Jute Mfg. Including Floor Covering (15.24%), Tea (14.96%), Rmg Of All Textiles (11.88%), Plastic & Linoleum (11.08%), Meat, Dairy & Poultry Products (9.83%), Carpet (8.9%), Organic & Inorganic Chemicals (8.32%), Oil Seeds (8.09%), Electronic Goods (7.85%), Cereal Preparations & Miscellaneous Processed Items (7.62%), Handicrafts Excl. Hand Made Carpet (7.19%), Cashew (6.84%), Drugs & Pharmaceuticals (4.67%), Engineering Goods (4.36%), Man-Made Yarn/Fabs./Made-Ups Etc. (1.59%) and Leather & Leather Products (0.07%) record positive growth during August 2024 over the corresponding month of last year.
- Services exports is estimated to grow by 10.84 percent during April-August 2024* over April-August 2023.
- Top 5 export destinations, in terms of change in value, exhibiting positive growth in August 2024 vis a vis August 2023 are Netherland (28.92%), Kenya (105.72%), Russia (44.61%), Brazil (27.05%) and U K (14.57%).
- Top 5 export destinations, in terms of change in value, exhibiting positive growth in April-August 2024 vis a vis April-August 2023 are Netherland (36.43%), U S A (5.72%), U Arab Emts (9.24%), Malaysia (40.06%) and U K (14.59%).
Industry experts believe that this upward trend in exports could further bolster the Indian economy, contributing to job creation and increased foreign exchange reserves. As the government looks to promote “Make in India” initiatives, the positive trajectory in exports serves as a promising indicator for the nation’s economic outlook.
